Map Catalog

Sunday, July 21, 2013

Isohyets


http://www.scoop.co.nz/stories/AK0808/S00090.htm
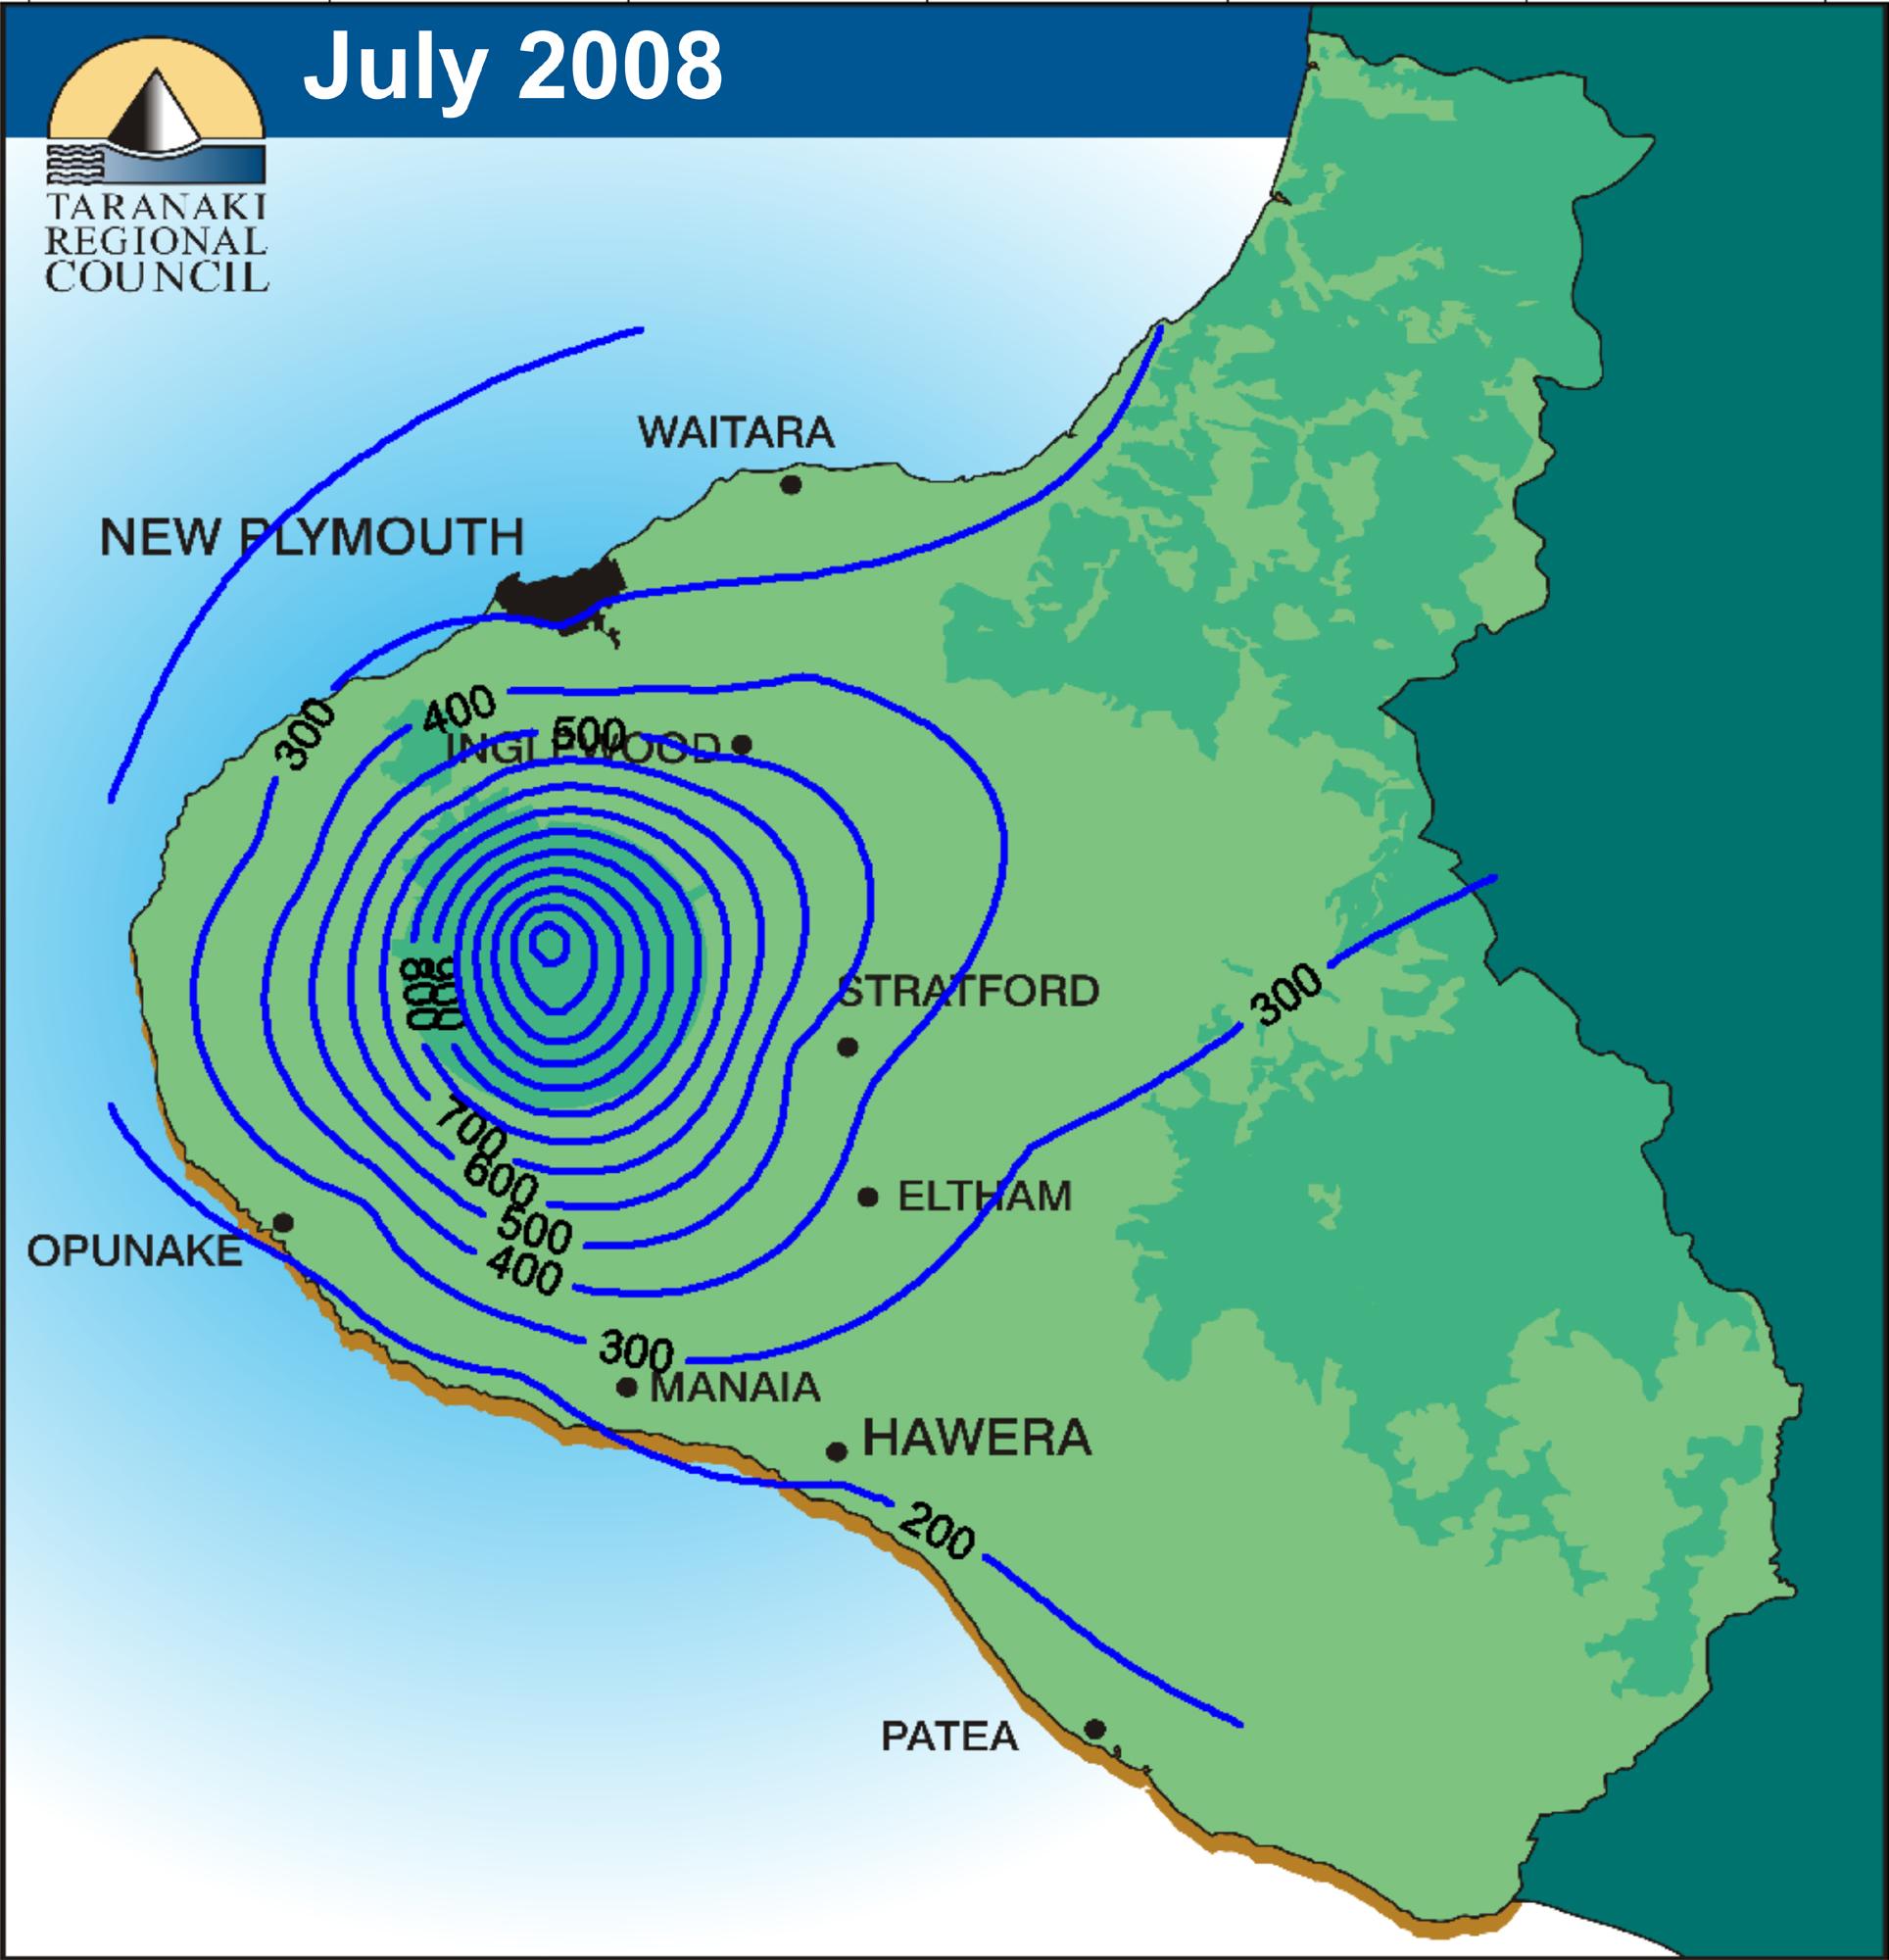
A line representing points that have the same amount of precipitation. The map above shows isohyets that show the amount of rainfall for the month in 100mm bands. The region in the Taranaki region of New Zealand.
Posted by Unknown at 6:14 PM
Email ThisBlogThis!Share to XShare to FacebookShare to Pinterest

No comments:

Post a Comment

Newer Post Older Post Home
Subscribe to: Post Comments (Atom)

Blog Archive

  • ▼  2013 (38)
    • ▼  July (38)
      • stem and leaf plot
      • Histogram
      • univariate choropleth map
      • Bivariate Choropleth Map
      • Unclassified choropleth map
      • Classed choropleth maps
      • Range graded proportional circle map
      • Continuously variable proportional Circle Map
      • DOQQ
      • DEM
      • DLG
      • DRG
      • Isopleth
      • Isopach
      • Isohyets
      • Nominal Area Choropleth
      • LIDAR
      • Isotach map
      • Bilateral Graph
      • Planimetric Map
      • Thematic maps
      • Topographic
      • Planimetric Map
      • Mental Map
      • Isobar
      • Cadastral Map
      • PLSS MAP
      • Hypsometric maps
      • Dot Distribution Map
      • Choropleth Map
      • Proportional Circle Map
      • Isoline Map
      • Flow Map
      • Cartogram
      • Statistical Map
      • Infrared aerial photo
      • Black & white aerial photo
      • Doppler Radar

About Me

Unknown
View my complete profile
Picture Window theme. Powered by Blogger.